Long Interest Rate Cycles and Your Bond Portfolio

Ever since the Federal Reserve Board began its “taper talk” in May 2013, anxiety in the bond market has been running high. The yield on 10-year Treasuries has jumped nearly 120 basis points – from 1.63% on May 2 to 2.80% on August 26. Given the recent historic lows of US interest rates over the last five years or so, many investors are starting to wonder if bonds have become the risky portion of their portfolios. From June 1, 2013 to August 14, 2013, investors moved a net $89 billion out of bond funds according to the Investment Company Institute, nearly reversing the $93 billion of inflows during the first five months of the year.
Many investors had grown accustomed to bonds’ past performance, which can be hazardous: during the 15 years from August 1, 1998 to July 31, 2013, long-term government bonds returned an annualized 6.90%, compared to just 4.66% for the S&P 500 Index, with 31% less volatility. I won’t make any forecast regarding whether interest rates will continue to rise, or how quickly they may return to historic averages. But I will note that for more than 30 years, US interest rates followed a fairly steady downward trajectory, culminating to the lowest interest rates in a generation. No wonder investors grew accustomed to thinking of fixed income as the safe part of their portfolios. What happens if the trend reverses and we enter a sustained period of rising rates? For insights on appropriate strategies for investing in bonds in a rising-rate era, we thought it would be instructive to look at some bond market history.
A Bond Refresher
Before we look back at decades of fixed income history, let’s refresh our understanding of bonds themselves. Bond prices have an inverse relationship with interest rates—when interest rates rise, bond prices fall, and vice-versa. Duration, a measure of a bond’s interest rate sensitivity, is the most important determinant of bond price movements. All things equal, for typical bonds the longer the maturity the higher the duration (or price volatility due to interest rate movements), and the smaller the coupon the higher the interest rate risk.
So for instance, a 10-year Treasury today with a duration of 8.7 (Source: Bloomberg) will rise or fall nearly 9% for each one-point shift in interest rates; a 30-year Treasury with a duration of 18 will move approximately 18% for a one-point change in rates.
Long Cycles
Now let’s look at how bonds of different maturities and durations performed across long interest rate periods. Chart 1 graphs the two distinct interest-rate cycles from January 1956 through December 2012. From 1956 to 1981, yields on 5-year Treasuries soared from about 3% to 14%, driven largely by rising inflation. The Federal Reserve dictates the Fed Funds and other baseline interest rates based on the perceived need to either stimulate growth with low rates or to slow inflationary pressures with higher rates. Likewise, investors collectively drive yields up and down with their own near- and long-term inflation expectations. As a result, inflation tends to track interest rates quite closely, with a bit of a lag. Since Paul Volcker’s Federal Reserve helped to curb inflation in the early 1980s, 5-year interest rates have declined significantly, from 14% in 1982 to 0.76% in 2012, although in the last few months, yields had nearly doubled to 1.60% as of August 26 of this year.
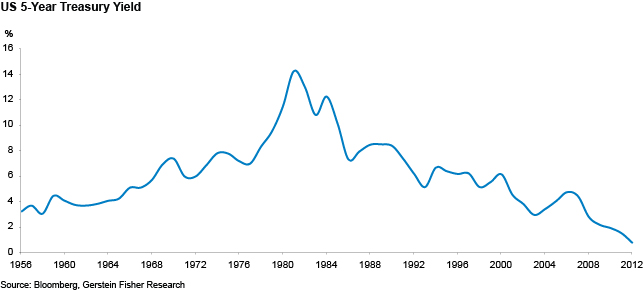
Chart 2 shows the returns of three different maturities of fixed income investments across two very different interest rate environments. As you can see, in a rising rate environment, such as prevailed in 1956-1981, short-term fixed income benefits substantially: with frequent reinvestment of principal due to recurring maturities, investors can easily take advantage of falling prices and rising yields. In this period, one-month T-bills performed best, while long-term bonds were the laggards. Indeed, from January 1, 1956 to December 31, 2012, one-month T-bills—which had a slightly negative correlation with the S&P 500 Index—had a relatively strong 0.461 positive correlation with the consumer price index according to Morningstar, implying that short-term paper makes a handy inflation hedge. On the other hand, in falling rate environments (e.g., 1982-2012), long-term bonds tend to out-perform, due to their ability to lock in a relatively high yield early in a declining rate period.
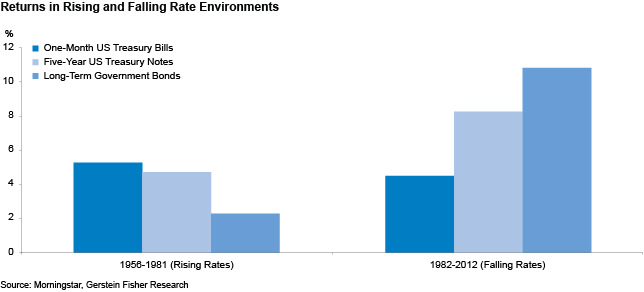
The disparity in returns among these three basic categories of fixed income (cash-like, short-term, and long-term) points to the logic of relying on short-term fixed income as a stable asset class in a variety of environments. In the two periods shown in Exhibit 2, five-year treasuries only slightly underperformed one-month bills from 1956 to 1981 (by about 50 basis points) and underperformed long-term government bonds by roughly 2.6 percentage points from 1982 to 2012, the era of declining rates. From a risk-adjusted perspective, using standard deviation of returns as a measure of risk, however, five-year treasuries look substantially better than longer-duration bonds, with less than half of the annualized standard deviation from 1982 to 2012 (4.9% for the treasury notes vs. 10.8% for the long-term government bonds). Finally, note that if you need to sell a bond for liquidity when rates are rising, you’re in a better position if it’s short-maturity paper as opposed to a long bond with a much higher degree of price volatility due to its longer duration.
Conclusion
Many market participants wonder if a long cycle of declining interest rates has come to an end. Looking back over history reveals that allocation to short-term fixed income benefits portfolios during rising rate environments. Shorter-term bonds historically also fare well on a risk-adjusted basis during periods of falling rates.
To read more of my writing, visit my firm’s website here.
If you liked this post, don’t forget to subscribe to Inside Investing via Email or RSS.
Please note that the content of this site should not be construed as investment advice, nor do the opinions expressed necessarily reflect the views of CFA Institute.

One comment on “Long Interest Rate Cycles and Your Bond Portfolio”