Access to Capital: Do Equity Markets Serve SMEs Well?

In the midst of the stagnation engulfing western economies following the financial crisis, policy makers on both sides of the Atlantic have turned their attention to small and medium-sized enterprises (SMEs). Lauded as job creators and the engines of economic growth, SMEs have been hailed as a route out of the economic malaise. This view has led to a flurry of initiatives to facilitate their access to capital, including the creation of specialised exchanges in Europe, reduced regulatory and reporting burdens, and various other accommodative measures under the JOBS Act in the U.S.
In a recent European Central Bank survey, access to finance was identified as the second-most pressing problem facing Euro area SMEs (the first was finding customers). According to the ECB survey, the supply of bank loans, a key source of financing for SMEs, declined by 22% in net terms between April and September 2012. And with banks facing tougher capital and liquidity standards, this situation may persist for some time yet. Against this backdrop, it is not surprising that policy makers are focusing on the ability of equity capital markets to better support SMEs’ financing needs.
But equity capital markets have not fared well in recent years; in fact, 2012 was the worst year for Global IPOs since the depths of the financial crisis. Growth in the number and value of IPOs has either stalled or reversed (see charts); moreover, those companies that do list continue to underwhelm.
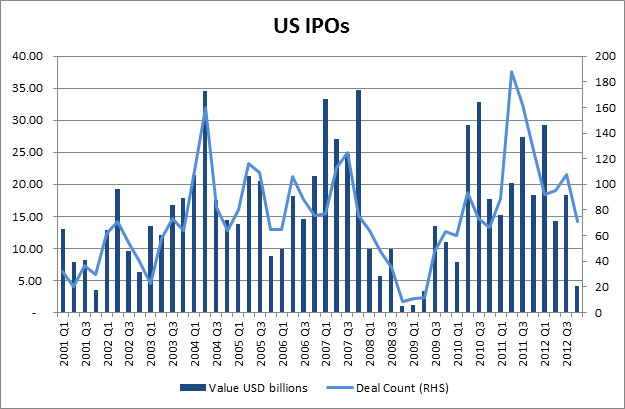
Source: Based on data from Bloomberg
But behind the big picture, the distribution of deals by offer size reveals a more interesting phenomenon. The chart below shows the percentage change in average deal values for the period 2007-2012 compared to average deal values for the preceding 10 years. The chart illustrates that average deal values have fallen markedly in Europe across all offer-size categories. In the U.S., deal sizes have exhibited similar declines for all but the largest offer-size category (> S10 billion), which exhibits a huge increase, although this is likely attributable to the occurrence of a few mega-cap companies listing in recent years (such as the Facebook offering). But a more troubling trend is revealed in the number of deals taking place within each offer size category, shown in the subsequent chart. While there is little change in the number of large cap deals, the number of smaller deals (offer sizes less than $500 million) has declined dramatically in both Europe and the U.S.
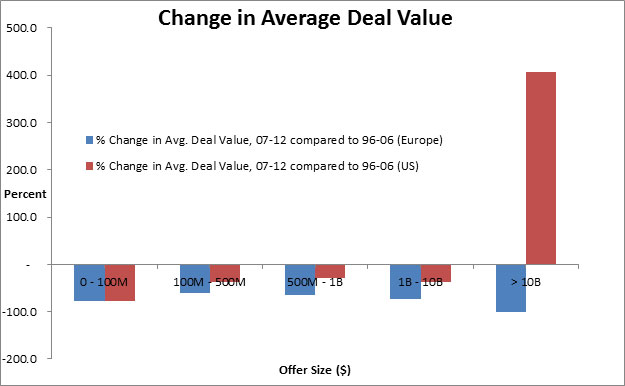
Source: Based on data from Bloomberg
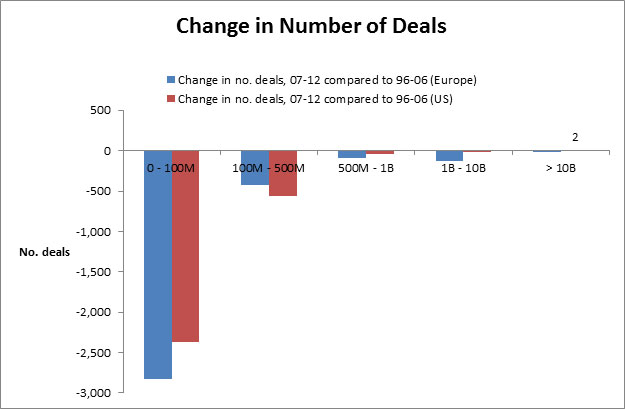
Source: Based on data from Bloomberg
The pertinent question to ask is, does this reflect a structural shift in the equity market ecosystem, such that it only works to serve the funding and trading of large, liquid issues to the neglect of SMEs?
A September 2012 paper by Grant Thornton asserts the latter view. The paper claims that regulatory changes over the past decade —most notably decimal pricing — have driven down tick sizes and spreads to as low as 1 cent, a level that is deemed to be insufficient to sustain capital formation for smaller companies. The paper claims that with such small pricing increments, brokers can no longer generate sufficient aftermarket revenues to fund research, salesmanship, and capital support for smaller companies. In other words, only the largest, most liquid issues can prosper in this environment.
Last month, the U.S. SEC announced that it will hold a roundtable on 5 February to evaluate the impact of tick sizes on the securities markets (partly following from the JOBS Act requirement for a study on tick sizes). The roundtable will examine the effect of the current tick size policy on SMEs and consider alternatives to the current one-size-fits-all framework, where all stocks priced above $1 have a minimum price variation of 1 cent.
Would a more flexible tick size policy help? Here, Europe again provides a useful parallel. Currently, there is no mandatory tick size policy, although it is an issue policy makers are considering. In most European counties, tick sizes vary according to different price levels. In France and Germany, for example, the minimum tick size is generally 0.001 for stocks priced less than €10, 0.005 for stocks greater than or equal to €10 to less than €50, 0.01 for stocks greater than or equal to €50 to less than €100, and 0.05 for stocks priced greater than €100.
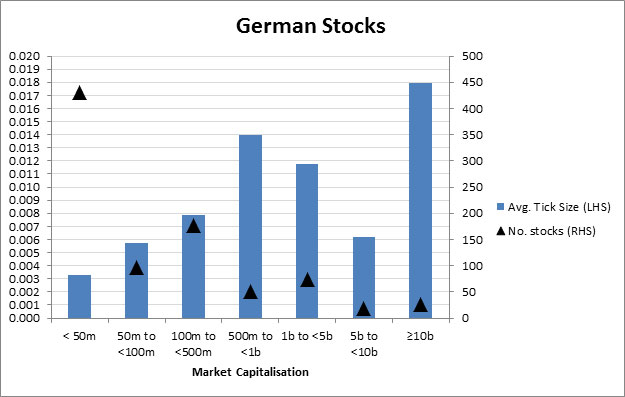
Based on these thresholds, the following charts illustrate the average tick sizes of stocks across different market capitalisation categories, for stocks listed and actively traded on the primary exchanges in France and in Germany.
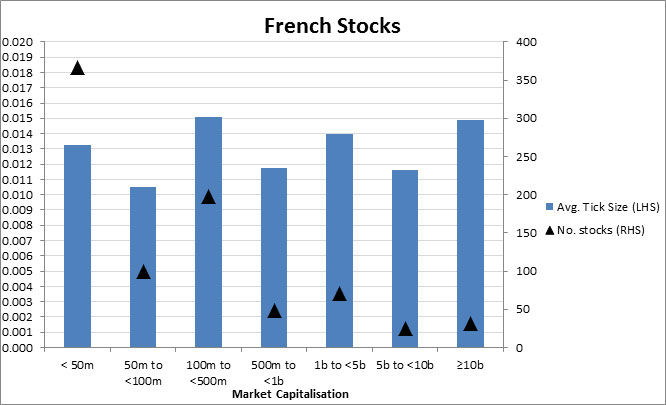
Source: Based on data from Bloomberg
Source: Based on data from Bloomberg
In France, the tick size does not vary much across market capitalisation categories. However, in Germany, the smallest stocks, with a market capitalisation of less than €50 million (also the most numerous at 431) have the smallest minimum tick size, by virtue of the low average price level of stocks in this category (€11.83). This suggests that a tick policy based on price level alone would not do anything to improve the market ecosystem for SMEs, because it results in similar or smaller average ticks for small caps compared with large caps.
To conclude, it is difficult to tell ex-ante whether larger ticks for SMEs would allow more trading interest to coalesce for those stocks, thereby bringing back the revenues needed to support primary market activity. Regulators should certainly tread cautiously and refrain from potentially increasing transaction costs (through enforced larger spreads) unless there is hard evidence to support it. A pilot program, based on liquidity factors as well as the price level, is most likely the best approach. At the other end of the spectrum, smaller ticks might be helpful for very liquid but low priced stocks. For such stocks, which routinely trade at a 1-cent spread in the U.S., the inability for trading interest to amass at more displayed pricing increments could be favouring the internalization business, where sub-penny trading is permissible. Getting the tick size framework right could have important consequences for markets, investors, and the economy.