An Interview with Carlos Doblado
Carlos Doblado is a prominent Spanish market technician. He is a partner at the advisory firm Ágora Asesores Financieros EAFI SL, manages the mutual fund BSG Prometeo FI, and is a regular presence in the financial media. I first learned about Doblado when I was surfing the internet at the beginning of 2009 in a quest for tips to manage my personal portfolio of stocks. At that time, Doblado was publishing all of his stock alerts openly on the website of the Spanish financial newspaper El Economista. Prior to finding Doblado, all the technical analysts that I had read about were the kind who try to sell a get-rich-quick scheme to small investors by trading highly leveraged derivatives or stocks of companies on the brink of bankruptcy. I was really surprised by the fact that most of Doblado’s recommendations were for the same highly liquid stocks that I liked based on fundamental analysis and that the target prices he provided in each recommendation were in line with my own appraisal of the value of those companies. He also has been able to be out of the market during all the big corrections, including the 2008 panic, and started opening strategies across the board in March 2009. This made me interested in the discipline of technical analysis (TA).
Later on, I found out that some great investors use TA as an input in their investing decisions. For instance, the famous special situations expert Anthony Bolton likes to look at charts to at least find out how many people have bought into a stock’s equity story, and he usually seeks the help of a market technician to review his entire portfolio. Also, the great Michael Burry, who cut his teeth trading coffee futures, likes to use TA to avoid falling knives and to find buy points at very solid support. Even value investing ideologist James Montier, in tinkering with his screenings and back tests, has reached the conclusion that the use of a stop loss can add an extra 7% annual return to some of his value-chosen baskets of stocks.
Today, I had the opportunity to discuss with Carlos Doblado what the charts have to say about several current hot topics.
Gustavo Teruel, CFA: You have said several times that among technical analysts, you define yourself as a classical chartist. Could you explain the principles of this school of technical analysis?
Doblado: Have I really said that? How conceited one can sound to oneself. Yes, I am aware of having said that. I am a discretionary chartist, which means that I prefer to have control over decisions and prefer to read directly about prices rather than through indicators built from them. But I am not averse to other tools, especially ones of breadth/sentiment.
I’ve heard that you’re not very fond of oscillators. I’ve also witnessed some of your discussions with people who use them for their trading decisions in your web clinics. Does it have to do with the time frame in which you feel more comfortable? How reliable do you think oscillators are?
Maybe I have trouble making myself clear. It surprises me that I have argued with somebody who uses other tools. I never feel strong enough to do that. I may have expressed that I prefer my tools because of their strengths (simplicity) and shortcomings (noise). By and large, tools are less reliable the closer they want to be to prices; that’s why an oscillator is usually more reliable. But does it mean more profitable? Not necessarily, because, as you know, the key issue is not to be right or wrong but how we deal with being right and being wrong. In other words, the important thing is to have a speculation system with a positive mathematical expectancy.
We have spoken about establishing the stop-loss level at a price where a new low would be reached and that Nassim Nicholas Taleb has said that when he was a trader, he used this heuristic, which almost always signaled a forthcoming panic among weak hands. How well does this trading rule work statistically, according to your experience?
In my opinion, this is one of the best trading rules if you’re looking for a certain level of reliability and not only sheer profit. And given that an upward trend depends on a series of higher lows, this is self-explaining if we’re trying to exploit trends. By the same token, if we were speaking about a downward trend, we’d have to pay special attention to lower highs.
Is there any technical pattern that you especially trust?
I prefer some patterns over others, although not because of their reliability but because some of them are less demanding in terms of stop loss. But I try to look at the market as a puzzle; consequently, for me, a pattern never is isolated. So, it’s difficult to place a lot of trust in something concrete.
What kind of characteristics do you seek in a given asset to trade?
I look for an asset in which there’s public participation and that is listed in a free market. Only in that case can we delve into crowd behavior, the key issue on which the power of technical analysis as a tool of behavioral economics is built.
Is there any asset that you think you’re unable to trade?
Certainly. I never trade options. And I think that by and large, it is not advisable to trade thinly traded issues, for different reasons. It’s clear that any asset can become unmanageable if there is excessive risk involved. As I’ve gotten old, I’ve lost interest in leverage.
As for the current market, you’ve been saying for the last few weeks that it is trying to beat epic resistance levels. In your latest column, you commented that even some indices that were lagging the general market, such as the Hang Seng, are joining the party. Could it be that we’re witnessing the Great Rotation from bonds to stocks? What do the charts say?
There are few epic resistance levels left, although I doubt that we can take for granted that they’ve been beaten yet. I also wonder if we can make a buck based on this fact. It’s hard to draw conclusions about the relationship between bonds and stocks in these times of financial repression. This is a correlation that we have put on hold, so to speak. What if the next thing we see is a correction in stocks and bonds at the same time? In the end, the long-term trends of stocks and bonds have been converging if you don’t take into account short-term noise. Frankly speaking, I’m a little lost in this area. It is the same with the dollar. Some correlations that are useful in the short term have not followed the same pattern over a longer time frame. Maybe we’re living in a time of slow transition to new paradigms.
Speaking of bonds, do you see any sign that U.S. Treasuries and German bunds are reaching a ceiling?
The monthly evolving patterns they are creating, unless there’s a dramatic change from now until the last day of May, are remarkable — not to mention the head-and-shoulder patterns in the short term that are already in the works.
If there finally is a sustained economic recovery in the U.S. economy, do you think that homebuilders could be in the midst of a multiyear rally? How do you view these stocks?
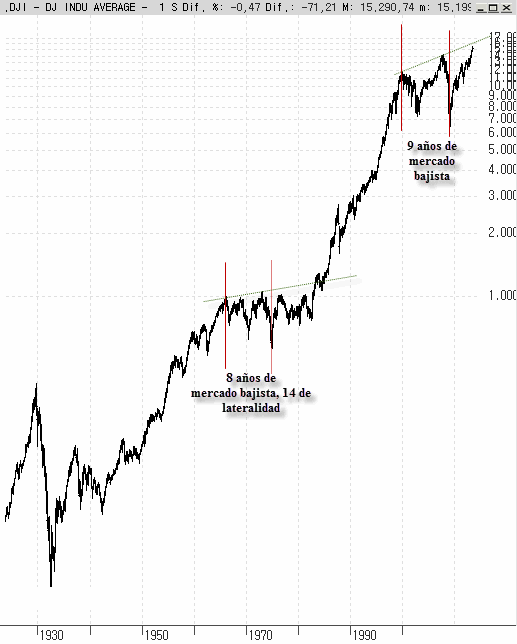
History doesn’t back the idea that the assets that have gone through a cycle of boom and bust and reached bubble levels are the ones that lead the subsequent recovery. It would be unprecedented. But they undoubtedly would take advantage of the recovery. That’s why I speak about epic resistance levels: If they were beaten in the total return chart, it would leave the market ready for a secular trend after a lateral/bear market, such as the one we have had since 2000. There was also a great lateral/bear market between 1966 and 1974, before the great bull market of the 1980s and 1990s. But the generational low was in 1974, not in 1982, despite what many people think. We had another lateral/downward move between 2000 and 2009. In 2009, the S&P 500 Index was very far from the 200-year mean of its annualized long-term return, at a distance only witnessed just after the crash of 1929, in 1942, and in 1974. We would be getting out faster this time, maybe because of the Fed, but there were conditions for a generational low back in 2009. And you know that this is something that I’m not just saying now but that we warned about at the end of 2008; we proposed an operative framework that we called “C for BaraCk” and that we activated in March 2009. Still, I insist, we can’t take for granted that the epic resistance levels, the ones that would correspond with the levels of 1982, have been beaten yet.
Does the European banking sector say something to you? What would need to happen for it to be in a medium-term upward trend?
Nothing; it already is. Or are we going to wait until it beats the highs of 2007 to think that we are in a bull market?
Let’s finish this overview of the most popular asset classes with gold, which seems to have responded to all the forecasts based on technical analysis in the last few months. How’s gold’s technical situation?
In a crucial moment, if the correction continues, it would damage gold’s medium-term profile more than what I expected. Up to now, I have seen the situation as a pullback in the long-term trend. But if we go further, something might have changed in the background.
You’ve also made a call recently on Apple. Could you explain the reasoning behind this call and your target price?
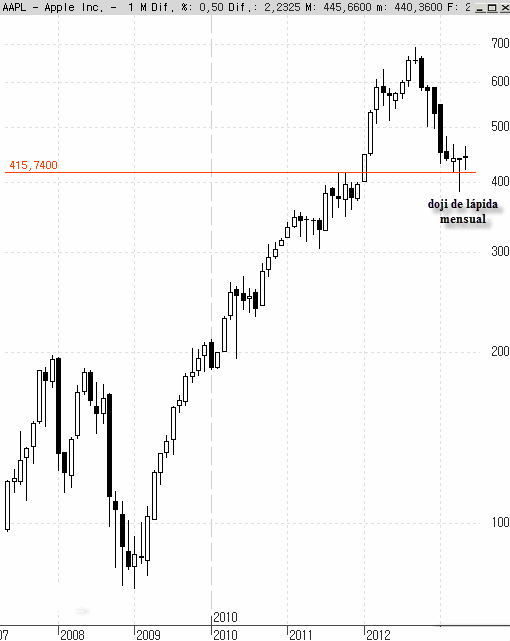
Honestly, we just found the powerful monthly doji trading pattern that the price drew in April irresistible. I don’t want to wait for a great reversal pattern because it would make us wait too long. And it’s not easy to wait because the stop-loss levels grow wider and wider. The reliability is certainly higher, but at what cost? I’d rather have more mistakes but lose less money with each one of them. I’ve been 18 years in this industry to allow the brain inertia to lead me. Clinical psychologists have proven that a loss of X has twice the effect on our brains as a gain of X has. So, think about how ill designed we are to understand what it means to have a positive mathematical expectancy in our favor. This game continues to be more a question of attitude than aptitude.
If you liked this post, don’t forget to subscribe to Inside Investing via Email or RSS.


