Are Investors Getting Rolled? Study Shows Whether HFT Worsens Adverse Selection

CFA Institute has just released a report, Liquidity in Equity Markets: Characteristics, Dynamics, and Implications for Market Quality. This research was motivated by two common practitioner complaints about modern equity markets.
First, the perception is that modern market structure has created a set of incentives that disadvantage investors and traditional market participants, such as market makers. Specifically, so-called broker/dealer internalizers purchase retail order flow from brokerages (e.g., your stock purchase made through TD Ameritrade) and fill the orders against their own principal. Only “informed” orders (i.e., those not profitable to trade against) are routed to exchanges, causing so-called “adverse selection” risk.
Why is adverse selection a bad thing? Who wins & loses?
This means that, relatively speaking, limit orders posted on exchanges (aka “lit” venues) are often executed against when those limit orders are on the wrong side of the trade, thus incurring a loss. This may increase the spread on quotes that are posted to compensate for this “adverse selection” risk, and/or reduce the incentive to post lit orders at all. The effect is to discourage from lit markets all but the most sophisticated traders, such as high-frequency traders (HFTs) who are able to better manage these risks because of their speed advantage.
Does dark trading disincentivise investors?
Second, investment professionals are concerned that displayed liquidity is unrepresentative of the true ability to execute trades. The argument here is that HFTs post numerous duplicate limit orders to increase the probability of execution (or as part of some other strategy) because they know they have the speed advantage necessary to cancel the unnecessary duplicate orders before execution. The issue is that the depth markets may appear to have illusory (aka “phantom liquidity”), with the true addressable liquidity being smaller. This is analogous to advertising your car on three different websites even though there is just one car for sale, not three cars. However, if liquidity statistics were used they would document three cars for sale!
To understand the effects of these concerns on market quality, we studied the dynamics and characteristics of liquidity across equity markets in the United States, the United Kingdom, and France between 2010 and 2014. For each market 50 stocks (split between large and small caps) were selected, and quote and trade data acquired for two days in each month.
Electronic Market Makers Likely More Informed of Imminent ‘Quote Rolls’
First, we examined the effect of adverse selection on lit markets by estimating the ability of electronic or OTC (over-the-counter) market makers acting in a dealer capacity to selectively route their own order flow to exchanges only when these OTC market makers are on the right side of the trade (which I discuss in this blog post). Electronic market makers are likely to be better informed about imminent “quote rolls,” a phenomenon in which depth on one side of the order book is taken away by successive orders in a predictable manner until depth at the best price is exhausted and the quote rolls up or down.
A quote roll for Bank of America from the 6 June 2014 is shown below. In the first plot the shaded area represents the bid-ask spread with the price rolling down from $15.62–$15.63 to $15.61–$15.62 before rolling back up to $15.62–$15.63.
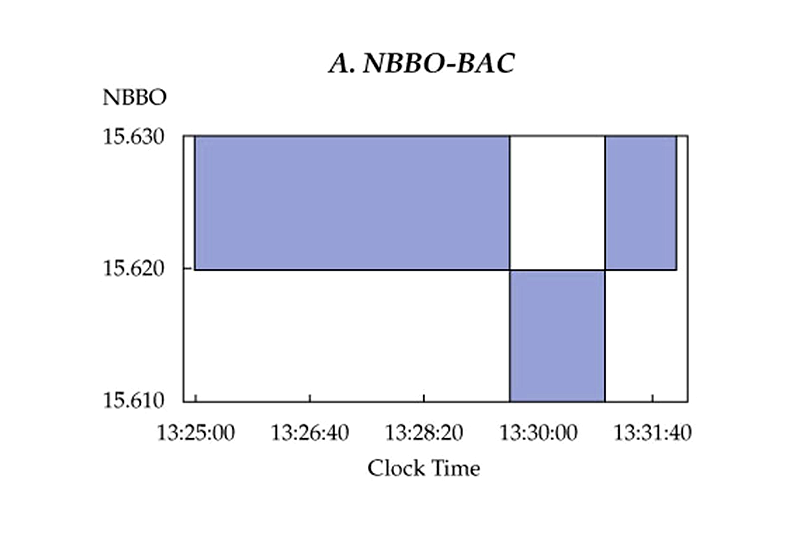
Source: Underlying data from Tick Data
The second plot shows the depth (depth on the bid side is measured down from the centre y=0 line, while offer depth is measured up from the centre y=0 line). We can see that the depth on the bid side falls away (i.e., trends up towards the y=0 line) just before the quote rolls down at around 13:29:40. The opposite happens shortly after and just before the quote rolls up.
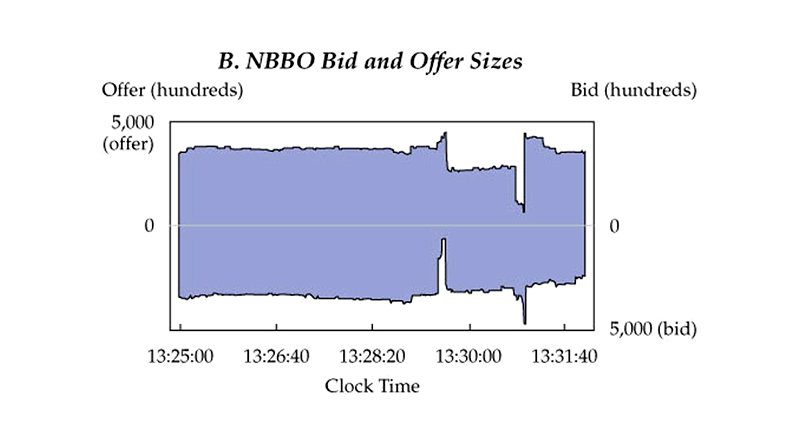
Source: Underlying data from Tick Data
When the quote is stable, internalization is posited to be, relatively, highest and OTC market makers deal profitably within the stable spread by leaning on the quotes posted on exchanges (as described in this blog post). Below is an extract of data just before the quote roll shown above, in which you can see a series of trades occurring off-exchange while the quote remains stable.
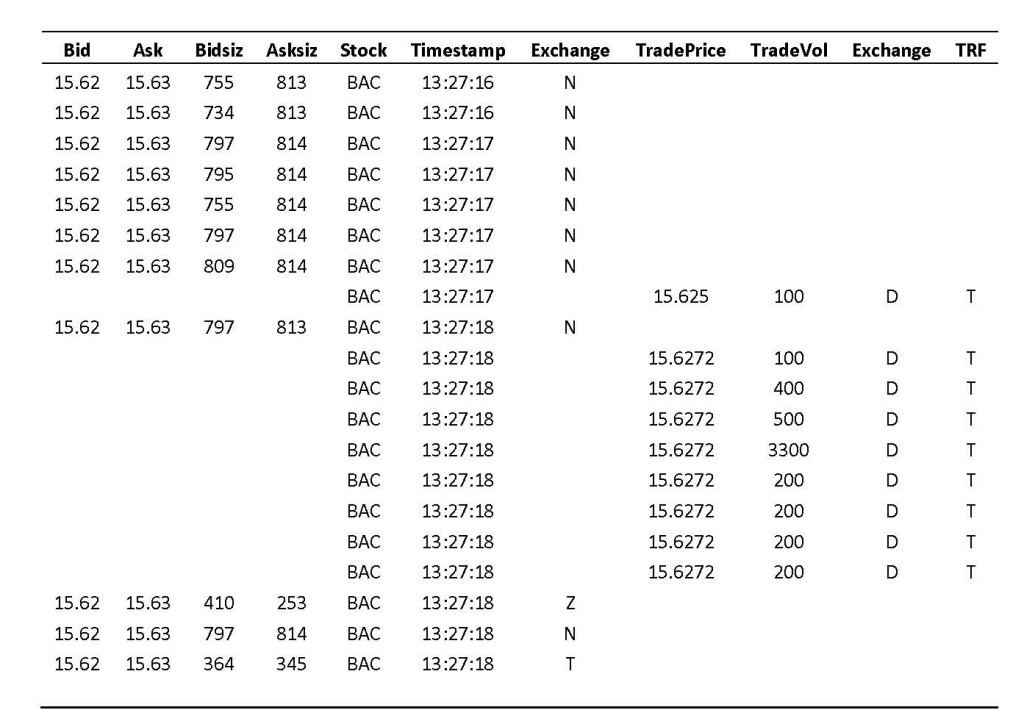
Source: Underlying data from Tick Data
Note in the table above that the quote is stable at $15.62–$15.63 with orders coming into the NYSE (code “N”). However, trades are being consummated off-exchange and reported through the NASDAQ Trade Reporting Facility (TRF) at either the midpoint of $15.625 or with a price improvement at $15.6272.
When OTC market makers predict (based on either order-book imbalances or short-term price prediction algorithms) that the quote is about to roll, they route their own orders to exchanges and trade in the direction of expected price changes (being on the “right” side of the trade). In this way, displayed liquidity providers are adversely selected against; they end up on the wrong side of the trade because more “informed” orders are routed to lit exchanges. Continuing the Bank of America illustration, the plot below shows a noticeable spike in lit venue trades (per 500 milliseconds) just as the quote rolls.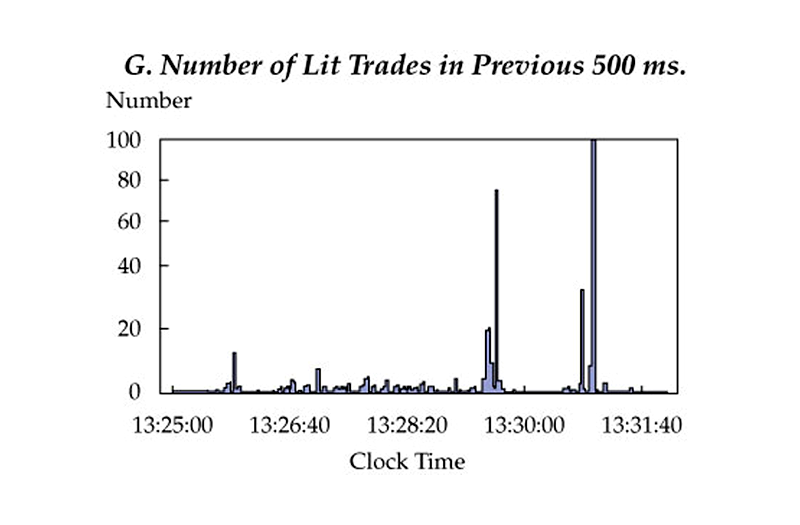
Source: Underlying data from Tick Data
By measuring the proportions of off-exchange or “dark” trading during periods when the quote is stable and when it is rolling (i.e., not stable), I could investigate the extent to which limit orders on lit venues are adversely selected against.
This study found evidence consistent with the quote roll phenomenon causing adverse selection on lit markets. Specifically, we document that the proportion of dark trading on US venues when the quote is stable is around 30–40%, which is approximately double the proportion of dark trading when the quote is unstable. The takeaway is that trading on lit venues happens relatively more when the quote is unstable, which is what we would expect to see if the quote roll phenomenon described above was happening on a systematic basis.
Why are electronic price improvement rule results different in the US than in the UK or France?
These findings are not as strong in the UK and are found only on a venue-by-venue basis, which may be a reflection of the lack of a consolidated tape and trade-through protection in the UK market. The analysis of French data showed that the phenomenon of quotes remaining stagnant for minutes or hours on end is very rare on French equity markets meaning the statistical tests could not be performed. This is an interesting result in itself and may reflect the relative lack of internalized retail order flow when compared to US and UK markets.
Second, we considered the extent to which depth at the top of the order book may be made up of duplicate liquidity by examining the impact of a trade on the order-book depth in terms of a multiple of the trade size. If there is no systematic duplication of limit orders, a trade of a given size is posited to have an impact on the depth in the order book equal to its size. That is, when a trade is executed for 100 shares, top-of-the-book depth will decrease by 100 shares as a direct result of the trade (the time was defined as within 50 milliseconds), not by, say, 300 shares.
This study did not find any evidence in any market consistent with trades having an outsize impact on order-book depth, suggesting no evidence of systematic liquidity duplication, at least at the top of the order book. That is, when a buy order of size 100 (for example) is executed, the offer depth 50 milliseconds later is typically the same as it was before the trade. That is, the order is not having a domino effect of order cancellations, which would be consistent with the phantom liquidity concept. Further, it seems that new liquidity is replacing the depth taken out of the market almost instantly. However, I do document some evidence that liquidity is replaced increasingly slowly on the main UK lit exchange (the London Stock Exchange, or LSE), which may be consistent with a reduction in the incentive to post lit limit orders.
Discussions with practitioners suggest that documenting true limit order duplication may require extremely granular data with the ability to follow the actions of individual traders across markets, something that may not be scalable to a market-wide analysis. For a case study of how phantom liquidity could operate, see this note from Nanex.
HFT Policy Implications: Don’t Throw the Baby Out with the Bathwater
The policy implications of these findings centre on the differences in results between the US markets, on the one hand, and UK and French markets on the other. The US markets provide trade-through protection, retail order flow internalization, and fixed tick sizes (or minimum price variation, also known as MPV). The UK and French markets have no trade-through protection, less extensive retail order flow internalization (indeed, payment for order flow arrangements are prohibited in the UK), and more variation in tick sizes (which are a function of the price level). Specifically, the fixed US tick size (MPV is 1 cent for all stocks priced above $1) may be hampering the ability of very liquid US stocks to achieve a true equilibrium price, which may explain why the proportion of trading in dark venues approximately doubles during periods when the quote is stable. In other words, liquidity may be constrained from amassing at equilibrium price levels on exchanges and is channelled into dark venues where subpenny execution is possible. Recalibration of tick-size policy (see our related study) to allow smaller ticks for more liquid stocks may be a way to reduce this phenomenon and thereby limit adverse selection.
The incentives in the US markets appear to generate behaviour that is consistent with increased adverse selection on lit venues. In contrast, the UK and French markets, with their different market structures, do not appear to see this behaviour to the same extent, if at all. This dichotomy should be an input into the debate on future market structure on both sides of the Atlantic.
However, this report should also be put into a broader context. The data shows that spreads, be they relative, depth-weighted, or effective spreads, are at historically low levels in all three markets — the US, UK, and France. In the US, the report documents spreads falling by a factor of five to 10 between 1999 and 2004, and remaining at around 2–3 basis points since then. Further, for large caps, the sizes available at the top of the order book are roughly double what they were in 1999, although small-cap dollar depth sizes are little changed. In the UK and France, since 2010, depth-weighted spreads for a 25,000 GBP/EUR transaction have also declined.
What strategies are institutional investors using to survive and thrive in today’s HFT-dominated market?
As Remco Lenterman said at this year’s E-Finance Lab Spring Conference (which I attended and blogged about), it is hard to argue for wholesale changes to market structure in the face of these trends, particularly given the unintended consequences observed since Regulation National Market System (Reg NMS). We suspect, however, that some small tweaks may be welcome.
The HFT horse has bolted. There have been upsides. Now we must adjust the reins to correct negative side-effects.
If you liked this post, consider subscribing to Market Integrity Insights.
Image Credit: iStockphoto.com/drogatnev
Say what you will, it is still front running. The specialist book is gone and with it any real depth in the market. HFT is phantom spoofing IMHO