What Is Non-Real Impact in Carbon Metrics?
Standard carbon metrics methodologies may not fully capture their underlying context, potentially leading to misinterpretation of results. In this article, we explore how market volatility creates misleading greening or browning effects in financed emissions (financed emissions relative to portfolio market value) and carbon footprint[1].
In our report, “Navigating Transition Finance: An Action List,” we examined how inflation and exchange- rate fluctuations impact the weighted average carbon intensity (WACI, which measures portfolio carbon intensity relative to issuer revenues). Here we highlight how market volatility can distort carbon metric comparisons over time, complicate medium-term target setting, and create additional reporting challenges because financial institutions must repeatedly explain these fluctuations. We also review current approaches to address these issues and emphasize the need for financial institutions to carefully refine their methodologies to make these metrics a useful tool for identifying and managing climate risks.
Financed Emissions for Listed Equity and Corporate Bonds
Based on the Partnership for Carbon Accounting Financials (PCAF) definition, financed emissions refer to the “emissions that banks and investors finance through their loans and investments” (PCAF 2022, p.132)[i]. For holders of listed equity and corporate bonds, the portion of annual emissions attributable to each shareholder or bondholder is determined by their share of the outstanding amount in listed equity or corporate bonds relative to the company’s value. This company value is defined as the enterprise value including cash (EVIC), and the resulting ratio is known as the attribution factor (Exhibit 1). Company value is defined as the book value of equity and debt, or total assets, for corporate bonds issued by private companies. In any case, the definition of outstanding amount and company value should be in line. Carbon footprint, which normalizes financed emissions per monetary unit, is useful for comparing different investments and portfolios. Both financed emissions and carbon footprint are commonly used metric for reporting and target setting.
Exhibit 1: Calculation of financed emissions and carbon footprint for equity and debt investment in listed companies.

Source: PCAF (2022)
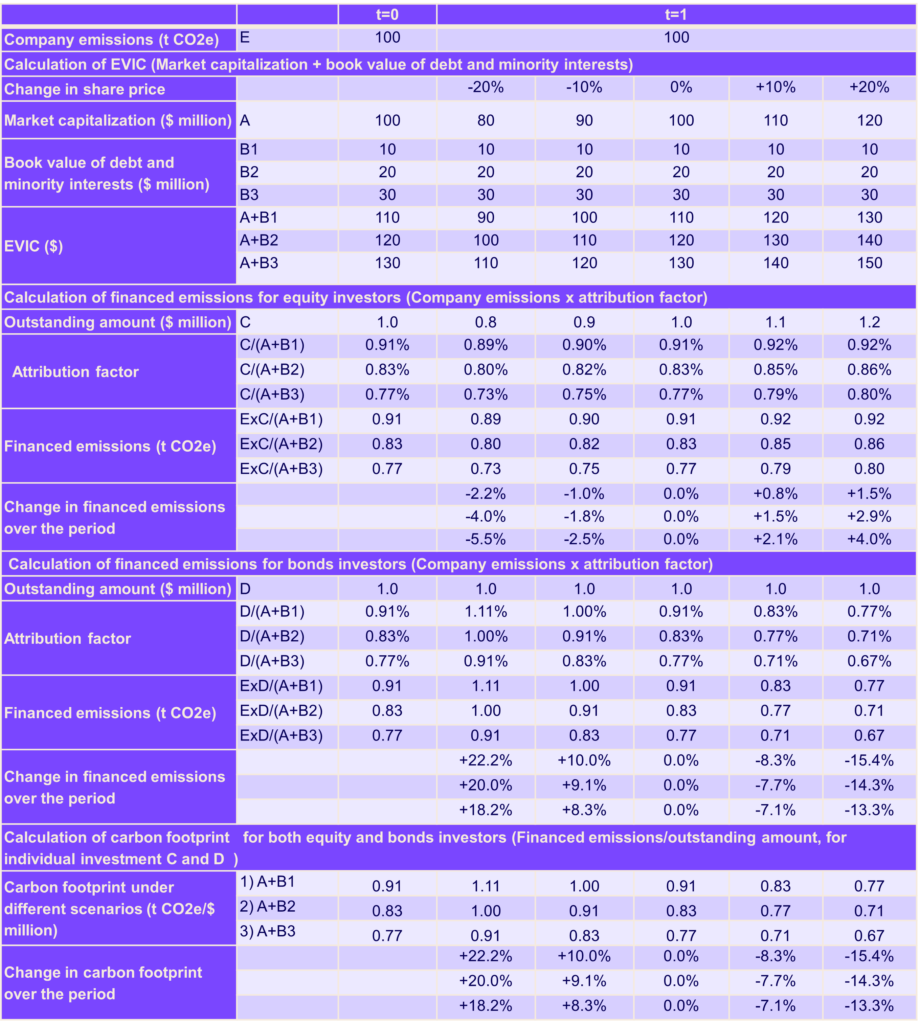
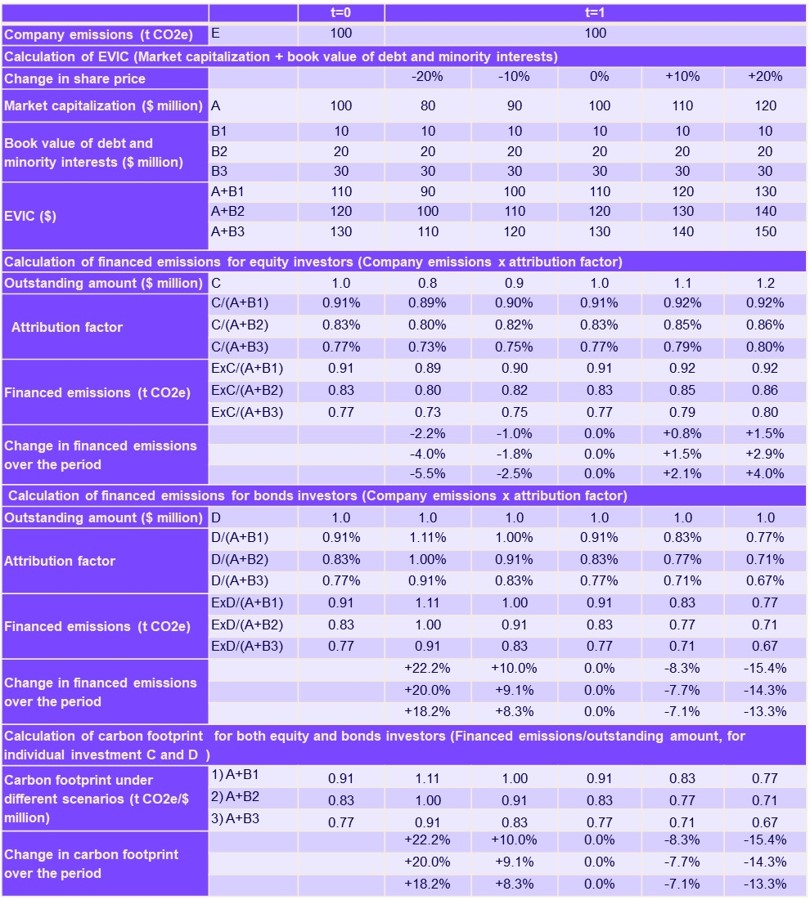
As stated by Blackrock (2023 p.38)[ii], “(financed) emissions and carbon footprint metrics are sensitive to fluctuations in asset values — particularly, though not exclusively, due to changes in EVIC from one period to the next.” To illustrate (Exhibit 2), we compare the sensitivity of financed emissions to the change in market value from period t= 0 to period t=1, based on a change in share price ranging from 10% to 20%. Specifically, we consider three baseline scenarios as of t=0: 1) market capitalization at $100 million and $10 million of debt and minority interests (A+B1); 2) market capitalization at $100 million and $20 million of debt and minority interests (A+B2); and 3) market capitalization at $100 million and $30 million of debt and minority interests (A+B3). For simplicity, company emissions are held constant at 100 tonnes of carbon dioxide equivalent (t CO2e) across both periods, and the outstanding amounts are the same for both equity and bond investors at $1 million in period t=0.
Exhibit 2: Sensitivity analysis of attribution factor changes under different capital structure scenarios.

The results show that:
- If share price rises over the period, equity investors’ attribution factor will increase and thus create ‘non-real’ browning effect. Unless the investee company’s rate of decarbonization exceeds the change of attribution factor, investors’ financed emissions will increase. Conversely, creditors’ attribution factor and financed emissions will decrease, creating a ‘non-real’ greening effect.
- The carbon footprint metric reduces the impact of this ‘role differentiation’ and enhances comparability, although it remains sensitive to market value changes and capital structure of the portfolio company (ratio of debt and minority interests to the market capitalization). The carbon footprint inversely correlates with changes in share prices, and a lower ratio of debt and minority interests to market capitalization results in higher sensitivity to these fluctuations.
Adjusting for EVIC fluctuations
Building on the suggestions by EU regulations on Climate Transition Benchmarks and Paris-Aligned Benchmarks (European Commission 2020)[iii] and EU Technical Expert Group (EU TEG 2019)[iv], the PCAF (2022) recommends adjusting the carbon footprint for changes in EVIC from the base year to enhance the utility of the metric for making comparisons from one period to the next (Exhibit 3), and reporting both unadjusted and adjusted figures separately if adjustment is applied.
Exhibit 3: PCAF’s recommended adjustment.

Source: PCAF (2022) p.63-64
The PCAF also highlights that adjustment can be applied to financed emissions for EVIC fluctuations, as well as many other market variables, such as exchange rates, but any adjustment will reduce comparability. It therefore recommends that financial institutions always report their unadjusted financed emissions in accordance with the PCAF standard together with the adjusted figures (PCAF 2022).
Citi applied the PCAF adjustment method to normalize its financed emissions and provided both unadjusted and normalized figures. It reported a 30.2% year-on-year reduction in financed emissions for its energy sector in 2021, reaching 100.3 million t CO2e. Although this initially appeared to exceed the group’s 2030 target of 102.1 million t CO2e, adjusting for EVIC fluctuations revised the 2021 financed emissions to 113.8 million t CO2e (Citi 2023)[v]. In 2022, the normalized emissions fell by 15.9% to 95.7 million t CO2e, more accurately reflecting the target achievement (Exhibit 4).
Exhibit 4: Citi’s financed emissions of the energy sector.

Source: Citi (2023-2024)[vi]
To account for EVIC volatility, Blackrock chooses to adjust its carbon footprint and reports both unadjusted and adjusted figures (Exhibit 5).
Exhibit 5: Emissions associated with BlackRock’s assets under management.

Source: Blackrock (2023)
Using Attribution Analysis to Reveal Externalities
Attribution analysis reveals how financed emissions are impacted by external market conditions such as stock and currency market volatility, factors that are beyond the control of financial institutions and do not reflect real-world decarbonization efforts. For instance, Deutsche Bank reported a 28.9% year-on-year reduction in financed emissions for its oil and gas sector in 2022, partly due to an increase in EVIC and total assets of borrowers and investee companies[2], which contributed to an 8.5% reduction of financed emissions during the period. The group’s financed emissions for the sector then rebounded by 11.4% in 2023, but no comparative figures of EVIC changes were provided (Deutsche Bank 2023-2024) [vii] [viii] While adjustment or attribution analysis can help to clarify carbon metrics by minimizing noise, it is crucial that these methods are applied consistently over time to effectively communicate climate risks and opportunities to stakeholders.
Using Multi-Year EVIC and Book Value for Stability and Consistency
To moderate market volatility for calculation of portfolio emissions, JPMorgan Chase (2023)[ix] and Morgan Stanley (2022)[x] use a three-year rolling EVIC. In addition, Barclays uses the book value of equity and debt for both listed and private companies to measure financed emissions consistently. The group noted that because progress in financed emissions needs to be monitored over multiple years, it is important to adopt a methodology that can be standardized across the entire portfolio, and that can minimize the impact of market volatility over time (Barclays 2024)[xi].
Using multi-year average EVIC and book value can help mitigate the effects of market volatility. However, as with adjusted financed emissions and carbon footprint metrics, any modifications to standard carbon metrics methodologies can reduce comparability between financial institutions.
Using Adjustments Consistently While Maintaining Comparability
Financial institutions must carefully refine their methodologies to avoid false positive greening or browning effects. Once a methodology is established, adjustments and analyses should be applied consistently over time to ensure effective communication with stakeholders.
In this article, we illustrated how investing $1 million in equity and another $1 million in debt of the same investee company can result in different allocations of financed emissions over time due to changes in EVIC, with carbon footprint metrics helping to address this “role differentiation.” However, stock performance can still affect the carbon footprint, much as inflation impacts WACI — as discussed in the “Navigating Transition Finance – An Action List” report. Such external factors should not influence the evaluation of environmental performance in investment portfolios or financial institutions. We provided real-life examples of how financial institutions use adjustment and attribution analysis to address the impact of market value fluctuations. Nonetheless, as the PCAF highlights, any modifications can reduce comparability, so unadjusted figures should also be reported.
[1] Also known as absolute emissions and economic emission intensity
[2] The S&P Global Oil Index rose by 19% in 2022
[i] PCAF (2022). Financed Emissions – The Global GHG Accounting & Reporting Standard (Part A). 2nd Edition (December). https://carbonaccountingfinancials.com/files/downloads/PCAF-Global-GHG-Standard.pdf
[ii] Blackrock (2023). 2023 TCFD Report. https://www.blackrock.com/corporate/literature/continuous-disclosure-and-important-information/tcfd-report-2023-blkinc.pdf
[iii] European Commission (2020). COMMISSION DELEGATED REGULATION (EU) 2020/4757, Article 7(3). https://ec.europa.eu/finance/docs/level-2-measures/benchmarks-delegated-act-2020-4757_en.pdf
[iv] EU TEG (2019). TEG FINAL REPORT ON CLIMATE BENCHMARKS AND BENCHMARKS’ ESG DISCLOSURES (September). https://finance.ec.europa.eu/system/files/2019-09/190930-sustainable-finance-teg-final-report-climate-benchmarks-and-disclosures_en.pdf
[v] Citi (2023). Taskforce on Climate-Related Financial Disclosures Report 2022. https://www.citigroup.com/rcs/citigpa/storage/public/taskforce-on-climate-related-financial-disclosures-report-2022.pdf
[vi] Citi (2024). 2023 Citi Climate Report – Our Approach to Climate Change and Net Zero. https://www.citigroup.com/rcs/citigpa/storage/public/2023-Citi-Climate-Report.pdf
[vii] Deutsche Bank (2023). Approach towards carbon-intensive sectors / clients (March). https://www.db.com/files/documents/csr/sustainability/sdd23/07-20230302-SDD-Approach-towards-carbon-intenstive-sector-and-clients.pdf?language_id=1
[viii] Deutsche Bank (2024). Non-Financial Report 2023. https://investor-relations.db.com/files/documents/annual-reports/2024/Non-Financial-Report-2023.pdf
[ix] JP Morgan (2023). Carbon Compass Methodology. https://www.jpmorgan.com/content/dam/jpm/cib/complex/content/redesign-custom-builds/carbon-compass/JPMC_Carbon_Compass_2023.pdf
[x] Morgan Stanley (2022). 2021 Climate Report. https://www.morganstanley.com/content/dam/msdotcom/en/assets/pdfs/Morgan_Stanley_2021_Climate_Report.pdf
[xi] Barclays (2024). Financed Emissions Methodology. https://home.barclays/content/dam/home-barclays/documents/citizenship/ESG/2024/2023%20Barclays%20Financed%20Emissions%20Methodology%20v1.pdf

