The QE Aftermath: What it Means and How it’s (not) Different
The advent of a new round of quantitative easing has significant impact for investors, but it’s important to understand what’s actually happening.
Last week the Fed extended its “low rates” language from 2014 to 2015, announced it would be purchasing agency mortgages at a rate of $40bil per month, and left the amount of mortgages open-ended and contingent on economic conditions.
This form of monetary stimulus, dubbed quantitative easing (QE), is confounding for many market participants, let alone the average American. The confusion is warranted: This type of QE takes place in a relatively unfamiliar area of the capital markets—agency mortgage-backed securities (MBS)—and the effects are not easily tracked and are debatable, even for other members on the Federal Open Market Committee (FOMC).
Mechanics of QE
Before we discuss details, let’s review the mechanics of QE. The following is what the process looks like:
- The Fed purchases agency MBS through the TBA (to be announced) market via primary dealers.
- The primary dealer sends the bond to the Fed that then credits the dealer’s Fed account.
- Agency mortgage pools are removed from the system, and additional “excess reserves” are pumped into the banking system.
A point of clarification is in order regarding the nature of these excess reserves. Over the past few years, analysts and the financial press have mistakenly assumed that banks are sitting on these excess reserves and not lending them out. My response is always to point them toward a 2009 paper by the New York Fed’s Todd Keister and James McAndrews.
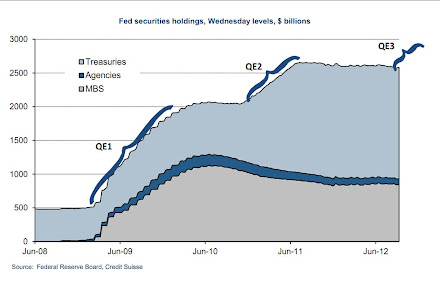
As the authors pointed out, “We explain, through a series of examples, why banks are currently holding so many reserves. The examples show how the quantity of bank reserves is determined by the size of the Federal Reserve’s policy initiatives and in no way reflects the initiatives’ effects on bank lending.” Even if a bank lends out the reserves, those reserves eventually end up at some bank. The only way for reserves to be drained from the system is if the Fed sells bonds or fails to reinvest in the runoff from paydowns. The following graphic shows the growth of the Fed’s balance sheet through the QE programs.
Impact of QE
Readers may want to reference Chairman Bernanke’s recent speech at Jackson Hole, in which he strongly defended the policy of quantitative easing.
Thus, Federal Reserve purchases of mortgage-backed securities (MBS), for example, should raise the prices and lower the yields of those securities; moreover, as investors rebalance their portfolios by replacing the MBS sold to the Federal Reserve with other assets, the prices of the assets they buy should rise and their yields decline as well. Declining yields and rising asset prices ease overall financial conditions and stimulate economic activity through channels similar to those for conventional monetary policy.
As the chairman stated, the Fed’s purchases of agency MBS forces investors into other risky asset classes as the prices of these bonds rise (yields fall). To put the purchases in perspective, it’s important to understand the monthly production of agency MBS.
At the moment, about $125 billion of agency MBS (mortgages backed by Fannie Mae and Freddie Mac) are produced each month. Through Operation Twist and the reinvestment of previous rounds of QE, the Fed is already purchasing ~$30 billion of bonds per month.
Add in the $40 billion per month that was just announced for the third round of QE (QE3), and the Fed is purchasing ~$70 billion of the ~$125 billion that is produced each month. Purchasing nearly 60% of the gross issuance of MBS obviously has a major impact on the market and forces investors into other asset classes.
Affected Asset Classes
Fixed-income spread products, including investment-grade (IG) and high-yield (HY) corporates and non-agency MBS, are among the specific asset classes that have benefited from the Fed’s balance sheet expansion. I recently compiled a table using data from Amherst Securities that shows just how far these asset classes have rallied since the trough in early 2009. Although some of this rally can undoubtedly be attributed to economic recovery, the chase for yield is in full force; this table does a good job illustrating the extent of it.
Going forward, it appears that QE3 should continue to be bullish for these sectors. In a recent report, J.P. Morgan noted that there is projected to be ~$31 billion of net monthly supply of spread products for the remainder of the year—an amount well below the $40 billion that the Fed is purchasing.
Simply put, more money will be displaced into spread products (IG and HY corporates, municipals, non-agency MBS, commercial mortgage-backed securities, etc.) than into new available supply. These fundamentals are very bullish for these types of products and will promote exactly the type of risk-seeking behavior that Chairman Bernanke is hoping for.

Impact to Average American
As stated above earlier, one of the goals of purchasing agency MBS is to lower yields on these securities and drive down primary mortgage rates so the average person can refinance into a lower rate. Skeptics may counter that both growth and inflation expectations have dramatically fallen over the past few years and that mortgage rates may have fallen even without QE. Such arguments are tough to prove, and my personal opinion is that the Fed’s decision to pull more than $1 trillion of agency MBS out of the system has had a dramatic impact on yields.
Since 2006, the effective interest rate on mortgage debt outstanding has fallen from 6.43% in 2006 to 5.04% today. We know many people cannot refinance because they are underwater on their mortgages (although the Home Affordable Refinance Program [HARP] is increasingly helping with this issue), but a large percentage of the population has refinanced and significantly lowered their monthly payment. To see how this practically plays out, consider the following chart, which shows the principal and interest (P&I) payment based on the median existing home sales price and the 30-year fixed mortgage rate. The P&I payment is down by $500+ dollars from 2007.

It may be even more helpful to view the P&I payments as a percentage of median incomes. As shown in the following chart, the P&I payment of the median home accounted for ~17% of the median income in 2011, down from ~27% in 2007.
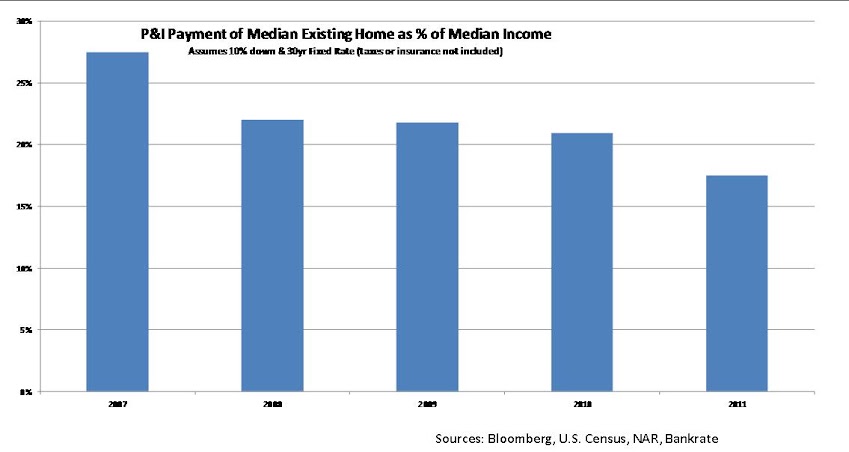
It’s clear from these data that many Americans have seen a sizable increase in their discretionary income because of lower interest rates. This policy hasn’t equally benefited all Americans, but it has made a significant dent. As Jefferies economist David Zervos said, “QE works, but QE is regressive. The easy money does not make it to all corners of the economy.” With the median income at roughly $50k, a $300–$500 reduction in a monthly payment is equivalent to a sizable increase in income.
Barriers Remain
Unfortunately, the effectiveness of QE is being severely hindered right now by a lack of capacity in the mortgage origination industry. The easiest way people measure this strain is by comparing what is called the “primary–secondary mortgage spread.” To make this comparison, the 30-year average fixed-rate mortgage is compared with the 30-year current coupon mortgage rate. The current coupon mortgage rate is the rate that would equate to a par bond price.
The lowest coupon being produced is 30-year 3’s (pools made up of loans with rates of 3.5%) that trades at ~104 cents on the dollar. The current coupon rate today is ~2.23%, whereas the 30-year average fixed rate to borrowers is 3.52%, leaving a spread of ~130 bps. As shown by the following graph, this spread is historically wide, meaning that borrowers aren’t reaping the full benefits of low rates.
I have surveyed a handful of people in the MBS industry, and a lack of capacity is almost universally cited as the reason for the widening of the primary–secondary spread. A very prominent West Coast fixed-income manager has said that banks don’t believe that low rates are a long-term phenomenon and thus are not willing to invest in additional jobs for what will be a temporary proposition—even if it lasts another two years.
In the interim, the banks continue to richly profit from origination. The second cited reason for the widening primary–secondary spread is the diminished presence of both Bank of America and Citigroup, which have both dramatically scaled back their mortgage origination business for a variety of reasons. The end result is that the average borrower hasn’t benefited as much as he or she should.
End Result
The data support the clear benefits that QE has had and will continue to have in certain segments of the economy. Nevertheless, unemployment is persistently high, inflation is relatively tame, and wage growth is anemic. How much will this iteration of QE really be different from QE rounds in the past?
Nomura’s Richard Koo, creator of the balance sheet recession theory, pointed out that monetary policy has lost its effectiveness when the private sector is deleveraging (or minimizing debt), despite near zero interest rates. More and more signs of this deleveraging are appearing in the U.S. economy. While major corporations shrewdly lock in long-term debt at record low rates, average Americans are reducing their mortgage terms. Instead of cutting their term in half and keeping the same monthly payment, they could be investing and spending the savings. Although I’m not saying people should be doing this, the psychology of decision making in the United States promotes deleveraging in many respects.
Consumers with healthy balance sheets will continue to reap the benefits of lower mortgage rates, and corporations will benefit from cheaper debt costs because of the insatiable reach for yield. Do the benefits of an open-ended QE program, which looks like it could be massively mispricing risky assets, justify such a dramatic action by the Fed? I am personally not convinced either way, but I am sure it will be a case study in many ways going forward. For now, I am optimistic that positive news in the housing market, modest job improvement, and strong corporate balance sheets will continue to build momentum with the aid of QE.
If you liked this post, don’t forget to subscribe to Inside Investing via Email or RSS.

Nice article and explanation of the channels the QE3 money could flow through. Thanks for that.
But how the lower rates and providing further chances to the underwater borrowers to refinance would promote a better risk management and risk awareness? As exactly the same policy is what lead to the current crisis…
I agree that in short term (2-5-10 years) this would inflate prices of assets (but mostly financial assets, as we see) but in a longer term this is hardly a sustainable course of action even if a buffer (or a “black hole” like the current FED’s purchases of MBS) is found. As Mr. Bernanke himself has said, one of the purposes of the QEs is to boost stock prices which in turn is expected to increase the disposable income and consumption. Apart from changing the traditional idea of the stock prices reflecting the condition of the economy into the modern one of the stock prices leading the economy, such a policy brings up the question of whether the stock prices or the prices of other assets in general, should be included in the measurement of inflation as those are expenses people make along with the more traditional ones. If the definition of inflation is expanded the whole effect of QEs on real growth would be much different.
Regards,
Emil