Investing in Currencies: The Problem with Benchmarks
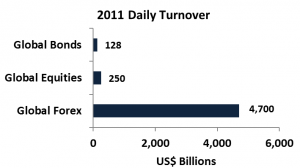
One of the most important and oft-discussed topics in asset management is benchmarking. Even though the daily turnover in global currency markets has reached over US$4.7 trillion1, investors need to be aware of some key issues when it comes to benchmarking currency portfolios.
Growth in Global Currency Markets
In terms of daily turnover, global currency markets are almost 20 times the size of global equity markets and about 36 times the size of global bond markets. From 2007 to 2010, just the daily spot transactions had a 48% increase, from US$1 trillion to US$1.49 trillion2
Key Drivers behind This Rapid Growth
The key drivers behind this explosive growth are increasing global trade, the rapid rise of emerging economies along with their foreign exchange reserves, and ever-increasing international investing. This in turn has led to the emergence of currencies as a tradable asset class from both a speculative and a hedging standpoint.
As an asset class, currencies have exhibited low correlation with traditional assets, such as equities, and hence are viewed as a potential source of “portable alpha.” Portable alpha strategies seek to add sources of return that have low correlation with the portfolio while maintaining its desired systematic risk exposures.
Managed currency programs are professionally run funds that seek to capture this portable alpha by actively trading in global currency markets. Such currency strategies, which were once accessible only to large institutions, are now within the reach of every investor.
Why Is Benchmarking So Important?
When it comes to managing portfolios, selecting the right benchmark is quite crucial for a couple of reasons. First, in most cases, a benchmark represents the default position of the portfolio manager in the absence of any active views. Hence, it acts as a starting point to formulate the expected risk–return preferences of the investor. Second, it helps in evaluating the performance of the portfolio and, by extension, the portfolio manager.
Now, if the benchmark is an investable one, things get more interesting. Because the investor has a cheaper way of accessing “asset beta,” from the investor’s perspective, the investment process can now be focused on finding portfolio managers who are able to generate alpha on a consistent basis.
One of the most important requirements for benchmark selection is a clear and unambiguous index construction methodology. Other important characteristics include daily pricing, low turnover, and availability of historical data.
Key Issue with Currency Benchmarks
The most important issue when it comes to building currency benchmarks is the lack of a “default market.” There is no such market because there is no real concept of “passive” investing when it comes to currencies. Investing in currencies is always an active investment decision.
For instance, in the case of equities, if you are long U.S. large caps, you would probably take “default market” exposure through the S&P 500 tracker. Just because you are long the U.S. large-cap sector does not mean you are short some other sector.
Currencies are always traded in pairs — for example, USD/EUR, USD/JPY, EUR/GBP. So, if you are long the USD/JPY pair, it basically means that you are long U.S. dollars and short Japanese yen. Every trade ends up being a relative value trade. As a result, there is no real natural market portfolio to measure and capture foreign exchange (FX) beta.
So, one has to find other factors that can explain and capture currency returns. With currency benchmarks, one can look at either strategy benchmarks or active manager benchmarks. Strategy benchmarks seek to capture FX “strategy” beta, while manager benchmarks, such as hedge fund indices, have currency funds as the underlying.
Strategy Benchmarks
The three main strategies at play in the FX markets are carry, momentum, and valuation. The carry trade is the most common one, and it seeks to exploit the so-called forward premium puzzle or forward rate bias — that is, the forward rate is not an unbiased estimate of the future spot rate. This trade involves going long high-interest-rate currencies while shorting low-interest-rate ones.
Momentum trades try to exploit the trending nature of currency markets and typically work well over short to medium time frames. Valuation strategy is based on a much longer time frame and involves using fundamental factors, such as the purchasing power parity, to identify overvalued and undervalued currencies.
The key issue with strategy benchmarks is the absence of universally accepted strategy definition rules. Different index providers have different rules to capture similar strategy betas, and hence, the risk–return analytics end up all over the place. Even in terms of correlations, strategy indices bear very little resemblance to each other.
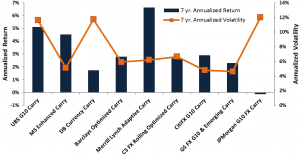
Exhibit 1 shows the annualized return–risk characteristics of some commonly used carry indices. The annualized return over a seven-year period (August 2005–August 2012) ranges from 6.5% a year to –0.1%, while the volatility ranges from 12% to 4%.
Exhibit 2 gives the cross-correlations of these indices.
Only a handful of correlations are above 0.75. In the case of equities or bonds, indices representing similar market segments — though constructed by different index providers — tend to have pretty high cross-correlations, around 0.9.
This clearly shows the lack of universally accepted rules when it comes to currency strategy definitions and, hence, the resulting strategy indices.
Manager Benchmarks
Manager benchmarks suffer from similar issues. As shown below, in the last 15 years or so, trading by currency managers has also grown exponentially, along with the growth in global currency markets. To accommodate this growth in active currency management, manager benchmarks have had to increase the number of underlying managers.
So, an index constructed in 1995 with, say, about 10 funds may now have about 100 funds. This means that the index that started off with a high volatility of around 15% probably now has a volatility of less than 5%!
This increase in the number of funds has ramifications for returns, too, because as volatility goes down, the returns also start to go down. This decrease in returns has important implications for investors because it probably is easier for a currency manager to beat these indices now than it was previously.
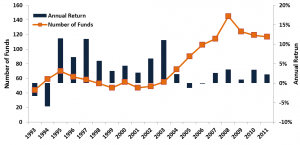
Exhibit 3 displays the evolution of the Barclay Currency Traders Index.
The Barclay Currency Traders Index, which had about 43 managers in 1993, went all the way up to 117 managers in 2011. This graph clearly shows the reduction in returns as the number of underlying funds increased.
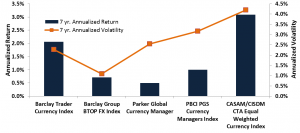
Exhibit 4 illustrates the risk–return characteristics of some commonly used manager indices over the seven-year period from August 2005 to August 2012. As with the strategy benchmarks, different index providers have different rules and, hence, different results.
Creating manager strategy indices like the current hedge fund indices may be impossible for a couple of reasons.
First, as mentioned previously, there is a lack of agreement when it comes to strategy definitions. Second, and more importantly, currency managers typically have more flexibility than other asset class managers to adopt different styles to suit market conditions. As a result of this style drift, it is impossible to pin down a manager to one particular strategy.
Benchmarking Currency Portfolios — The Way Ahead
To summarize, unlike with other asset classes, benchmarking managed currency portfolios is not straightforward. The lack of well-accepted and established benchmarks makes it tricky to evaluate currency portfolio performance.
Possible solutions include coming up with multi-strategy benchmarks and putting together a well-researched peer group of currency funds.
If you liked this post, don’t forget to subscribe to Inside Investing via Email or RSS.
1. Bank for International Settlements.
2. Ibid.
Please note that the content of this site should not be construed as investment advice, nor do the opinions expressed necessarily reflect the views of CFA Institute.


