Why do we need another Greek Letter in Portfolio Management? An Introduction to Omega

Editor’s note: Though technical, this article gives a good overview of how quantitative methods can be used to improve investment management processes. Even if you don’t follow the math, it will be useful to read through the reasoning.
“Study the past, if you would define the future” – Confucius.
The above observation by Confucius, which he probably made with reference to life, seems to make as much sense if not more when it comes to finance. Statistical analysis of historical return distributions is generally a good starting point in order to formulate some expectations of the future.
When it comes to describing distributions, moments play an important role. They are quantitative measures that try to capture the different aspects of a distribution. For example, the first two moments, mean and variance are quite well known. Higher moments such as skewness (‘slant’) and kurtosis (‘peaked-ness’) convey additional information that is quite important when assessing tail risk.
The most commonly used portfolio performance measures rely mainly on the first two moments of a portfolio return distribution. Not only are the higher moments neglected, the portfolio returns distribution is often not checked for normality. Normality refers to certain neat mathematical properties of the Gaussian distribution also more commonly known as the ‘Bell curve’.
Empirical evidence clearly shows that in most portfolios higher moments are often present and are too important to be ignored. Moreover, evaluating fund managers based primarily on their mean returns can skew performance measurement and hence, the resulting analysis.
The Omega measure, introduced by William Shadwick and Con Keating in 2002, addresses the above concerns. It is used to measure portfolio performance relative to a benchmark and also against an acceptable threshold level. Simply put, the Omega measure is a ratio of probability weighted returns above the threshold level to probability weighted returns below the threshold level. The exact mathematical definition of the Omega ratio is:
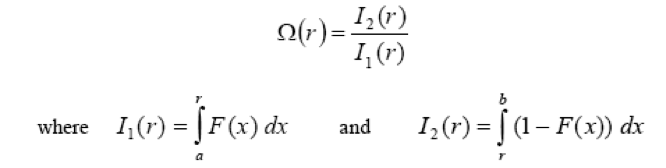
F is the Cumulative Distribution Function of the portfolio returns defined on the interval [a,b] and r is the given return threshold.
Hence, funds with higher Omega ratios are preferred over those with lower ratios. The main features of this measure are that it takes into account the higher moments of the return distribution while not depending on the return distribution of the portfolio or on any parametric assumptions or utility function specification. The first order derivative of the omega function is always negative and by definition, the flatter the function, the riskier the asset.
Omega Measure for Hedge Fund Analysis
There have been several studies that have reported the statistical nature of hedge fund returns. These studies agree that they are mostly non-normal in nature and typically exhibit negative skewness and high kurtosis. Table 1 shows some key statistical features of well-known hedge fund indices and Figure 1 illustrates their probit plots.
For normal distributions, one would expect the data points of the probit plot to form an approximate straight line. The reported data and graphs confirm the non-normality of hedge fund return distribution. Hence, it is quite evident that using a Mean-Variance optimization framework will not result in optimal portfolios as the investor’s utility function just takes the first two moments of the distribution into account.
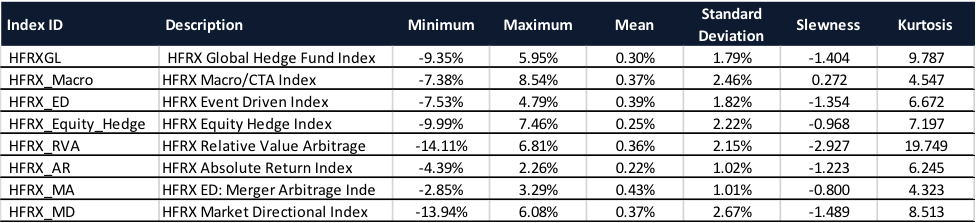
Table 1 (Based on monthly returns from Jan 2000 to Mar 2012 – Data source: Bloomberg)
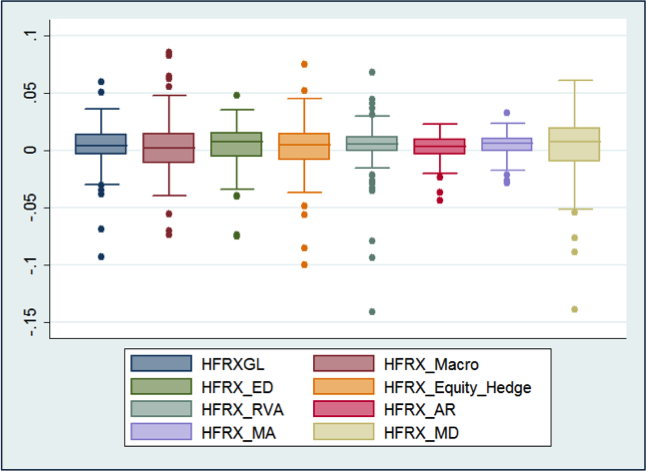
Figure 2 illustrates the return distribution for the above indices in a Box-plot format.
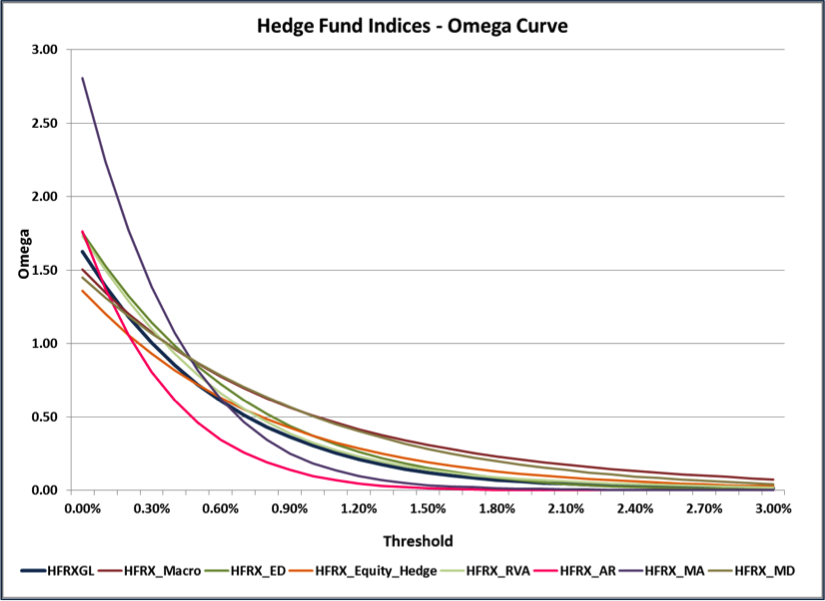
Figure 3 displays the Omega curves for a threshold from 0% to 3%. From Figure 3, the following observations can be noted:
- HFRX Equity Hedge & HFRX Market Directional exhibit the flattest omega functions while HFRX ED: Merger Arbitrage & HFRX Absolute Returns the steepest, which indicates that Equity Hedge & Market Directional have a relatively higher probability of displaying extreme returns and hence, are riskier than Merger Arbitrage & Absolute Returns.
The above fact is also reflected in the relatively higher standard deviation of Equity Hedge & Market Directional as shown in Table 1 and the greater dispersion in return distribution as shown in Figure 2.
- HFRX RVA & HFRX ED exhibit an intermediate position in terms of risk and the slope of their omega function makes it difficult to differentiate them, at most threshold levels.
- The crossing of the curves indicates a change of preference in the attractiveness of an asset. For instance, Merger Arbitrage is the most attractive asset (highest omega) at a zero return level. But for a loss threshold of approximately 0.6%, a risk averse investor is indifferent between Merger Arbitrage and Equity Hedge. For a loss threshold of 1.2%, Merger Arbitrage & Absolute Returns are the worst performing indices while Equity Hedge & Market Directional are the best performing ones.
- This shows that asset ranking may vary depending on the threshold at which a return is regarded as a gain or a loss. For example, an investor may consider any return below the risk-free rate as a loss whereas another will only perceive losses for reductions of the initial capital. This contrasts with mean-variance which implies that investors equally consider below-the mean returns and above-the mean returns.
Constructing Portfolios using the Omega Ratio
In a 2009 paper, Gilli et al. study the use of the Omega ratio to construct 130/30 portfolios. The authors investigate the effect of removing the no shorting condition used in many portfolio optimization studies by studying the empirical performance of the selected portfolios. The authors list pretty much the same rationale for using the Omega function as discussed above.
(The equations below are for the more numerically inclined. One can by-pass this and jump directly to the empirical findings without any loss of understanding.)
Their definition of the Omega function is an inverse of the one presented in the introduction; however, the optimization problem is also inverted to signify the same thing. They define the Omega function as follows:
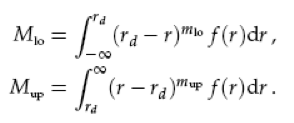
Omega is then defined as
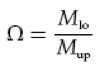
The optimization problem is now set up as:
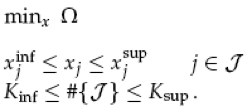
Where![]() and
and![]() are vectors of minimum and maximum holding sizes, for those assets included in the portfolio
are vectors of minimum and maximum holding sizes, for those assets included in the portfolio![]() .
.![]() and
and![]() are cardinality constraints to set a range for the number of assets in the portfolio. The dataset for this exercise comprised of more than 500 price series of European stocks in the Dow Jones STOXX index from Jan 1998 to March 2008.
are cardinality constraints to set a range for the number of assets in the portfolio. The dataset for this exercise comprised of more than 500 price series of European stocks in the Dow Jones STOXX index from Jan 1998 to March 2008.
In their empirical findings, the authors note the following key differences between Omega and Mean-Variance portfolios:
- Conditional on the applied data modeling procedure, the Omega function selected well-performing portfolios in terms of final wealth.
- Omega portfolios on average exhibit lower kurtosis than MV portfolios even though they have slightly higher volatility than MV portfolios.
- Asymmetry of the return distributions seemed more favorable for Omega portfolios; while both Omega and MV portfolios displayed higher upside deviation than downside deviation, the difference was more pronounced for the Omega portfolios
Conclusion
Based on the above study, it is quite evident that the Omega function adds value to portfolio optimization, more so when the assets under consideration demonstrate non-normal behavior. Investors are affected by all moments of the return distribution which needs to be reflected during portfolio construction. Even for normally distributed asset returns, Omega enhances investment analysis by considering thresholds below which investors consider given returns as a loss.
If you liked this post, don’t forget to subscribe to Inside Investing via Email or RSS.
Please note that the content of this site should not be construed as investment advice, nor do the opinions expressed necessarily reflect the views of CFA Institute.


I would like to subscribe
I would just like to make a couple of points on the use of Omega functions
First if you plot them as Log (Omega) they are much easier to read – superior portfolios can usually be identified visually.
Second optimisation around a single threshold may be done, (and you have illustrated this) but if you want to compare to Markowitz-type techniques, then you meed to consider the global position and that involves optimising the whole function.
Bill and Ana published a number of short pieces on how that might be done using metrics of the function.
Con Keating