Does It Matter How an Index is Put Together?

A few months ago, Kraft Foods Group was replaced by UnitedHealth Group in the Dow Jones Industrial Average. It turns out that the Dow Jones is a price-weighted index as opposed to a market-cap-weighted index (like the S&P 500) or an equal-weighted index, sometimes referred to as an unweighted index. A number of companies, including Russell and MSCI, have equal-weighted indices for a variety of sectors and markets.
OK, but what does this all mean? Does it make a difference how the indices are weighted? Many investors have long believed that the Dow and the S&P usually moved the same way.
To explore these questions, let’s look at three different stocks and see how the daily changes in their prices would affect the changes in the different types of indices.
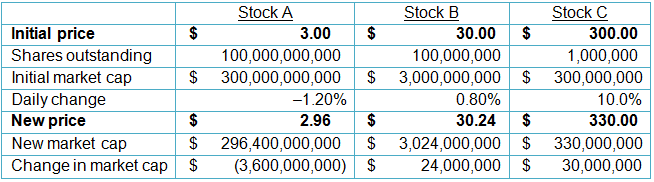
Let me point out a few pretty obvious things about this table. The highest-priced stock is Stock C ($300), whereas the lowest-priced stock is Stock A ($3). But don’t be fooled by the price difference! Stock A is actually the biggest company by market capitalization, at $300 billion.
Stock C had the biggest percentage move (10%), whereas Stock A actually traded down and also had the largest change in market capitalization.
Now for the fun stuff. Let’s see how the different ways that indices can be calculated would change the outcomes and daily performances.
Price-Weighted Indices
The most straightforward calculation of an index is a price-weighted index, such as the Dow Jones or the Nikkei. Very simply, you add up the prices of the stocks and divide by the number of stocks in the index. The number of stocks is called the divisor, which changes as time goes by owing to stock splits and things like switching Kraft for UnitedHealth.
For now, we will use 3 as our divisor. So, for our three stocks, the value of the index on the first day would be ($3 + $30 + $300)/3 = 111. Pretty simple. The value on the second day would be calculated in the same way: ($2.96 + $30.24 + $330)/3 = 121.07. The percentage change from one day to the next would be (121.07/111) – 1 = +9.07%.
Interestingly, this figure is close to the return on the highest-priced stock in the index. That’s no coincidence. It’s directly due to the fact that Stock C had the highest value in the index even though it did not have the highest market cap. IBM frequently has this impact on the Dow because it is the highest-priced stock of the 30-stock average but does not have the highest market cap.
This information can prompt misleading interpretations when one asks what happened to the overall value of equities today, as we shall see in the next example. This is why most professional money managers and institutions use the S&P 500 as a benchmark rather than the Dow Jones Industrial Average.
Market-Cap-Weighted Indices
As the name implies, these indices weight companies according to their total valuation, or market capitalization, which is simply the price multiplied by the number of shares outstanding. The S&P 500, as mentioned earlier, and the NYSE are examples of market-cap-weighted indices. Calculating the value for the first day, we get ($300,000,000,000 + $3,000,000,000 + $300,000,000)/3 = 101,100,000,000.
The value of the market-cap-weighted index on the second day is ($296,400,000,000 + $3,024,000,000 + $330,000,000)/3 = 99,918,000,000. The day-to-day change is then calculated: (99,918,000,000/101,100,000,000) – 1 = –1.17%. This time, the index actually went down! That makes sense given the change in prices and relative market caps of the companies. To be sure, Stock C went up by a lot on a percentage basis. But even with the increase of Stock B, that adds only $54 million in market cap, whereas Stock A reduces total market value by more than $3 billion. That’s a huge difference and a bit more reflective of reality, in my opinion.
Equal-Weighted Indices
These indices are sometimes referred to as “unweighted” because no single component has an outsize effect on the total index. The easiest way to calculate the change in this type of index is to take the mathematical average of the daily individual returns. For our purposes, that calculation is (–1.2% + 0.80% + 10%)/3 = 3.20%, which looks nothing like the returns of the other, “weighted” (whether by price or market cap) indices. Interestingly, it turns out that this approach is how most retail investors end up allocating their portfolios. They usually buy roughly an equal dollar amount of the various investments they make; using an equal-weighted index might make more sense when evaluating their investments’ performance relative to the overall markets over any given time period.
So, to sum up, depending on how we calculate the indices, there could be big differences in how they move. On a price-weighted basis, we were up almost 10%, but on a market-cap-weighted basis, we lost ground for the day. What do you think is the most sensible way to calculate the price of an index? Let me know (@sconsetcapital).
Please note that the content of this site should not be construed as investment advice, nor do the opinions expressed necessarily reflect the views of CFA Institute.